Absolute Value Hearts

by Zack Kroll


For this exploration we are examining the graph of the equation:

.

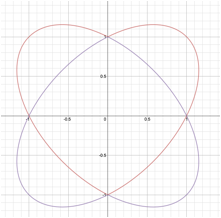
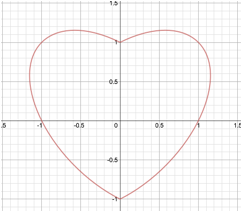
As we can see the figure formed on the coordinate plane resembles a heart.

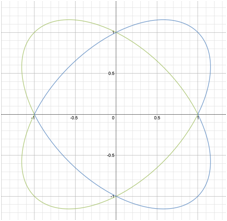
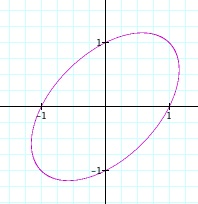
The graph of the equation without the absolute value is an ellipse. How does the addition of the absolute value manipulate the graph of the function? The absolute value of x is the reason that all negative values of x are positive. This prevents the graph from being an ellipse and instead reflects it over the y-axis. Therefore, the graph resembles a heart.


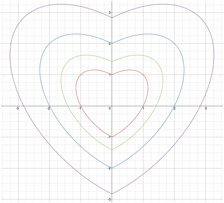
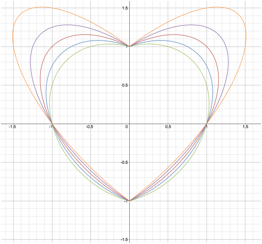
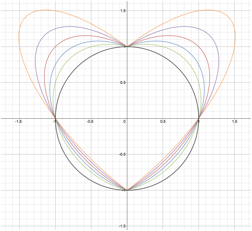
Our goal is to investigate the graph of this equation as well as determine if there are any other variations to this graph.

If there are other variations, what do the graphs of those equations look like?


A variation of the graph above is the original function along with the inverse function. There are two observations that we can make by looking at this graph. The first is that the inverse of the original function (blue graph) is a reflection of the orginal over the x-axis. The other interesting idea is that by By changing subtraction to addition the ellipses that were previously mentioned are now completed.


The functiongenerates a graph that is a 90 degree clockwise rotation. The function is a reflection of this graph over the y-axis. The overlap of the two graph creates the same image as the previous one, but as we can see the orientation is clearly different.


There are other ways to investigate this problem. We return to the original equation . However, by changing the constant that the expression is equal the figure is dilated.


By inserting a coefficient in front of y in our equation, we create graphs like the ones below. The coefficients of the graphs shown were 1, 2, 3, 4, and 5. As the coefficient increases the size of the image increases. However this is not a dilation as what occured in the previous set of graphs.